LSSMBB Online Practice Questions and Answers
The following is the best description for the purpose of a process map:
A. It is a tool used only after a Six Sigma project is completed
B. It is a tool to convert customer requirements to a set of measurable technical requirements with target values.
C. It is a tool for identifying alternative solutions or concepts
D. It is a tool used to identify all major steps, outputs, and inputs to look for potential causes of a problem.
What can you conclude if the Sum of Squares Error is larger than Sum of Squares for the Model?
A. R-Squareisgreaterthan0.5
B. R-Square is less than 0
C. R-Square is equal to 1
D. R-Square is less than 0.5
While checking regression model assumptions, an engineer generates the following normal probability plot of residuals. Which of the actions below is the most appropriate next step?
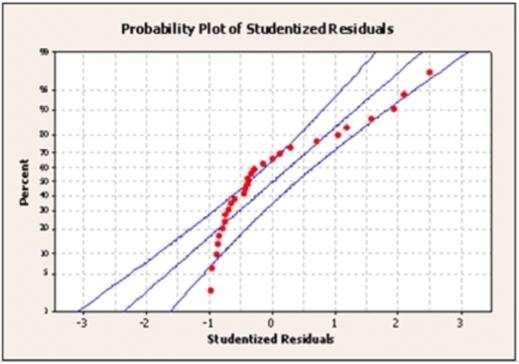
A. Transform the response and re-fit the model
B. Investigate run order for a time pattern
C. Add runs, collect additional data and re-fit the model
D. Remove the highest order term from the model
You have been asked to monitor daily production yields to determine if the process yield is in statistical control. Select the control chart best suited for this purpose.
A. C-chart
B. U-chart
C. X and R chart
D. P-chart
A ___________ is used primarily to track the stability of the average value of a metric of interest.
A. NP Chart
B. Xbar-R Chart
C. I-MR Chart
D. C Chart
A. Are downtime issues easily noted?
B. Can extra inventory be seen easily?
C. Are unneeded tools or supplies easily noted?
D. Are setups optimized for lower scrap levels?
Kaizens or Kaikakus and Six Sigma projects are intended to create incremental process improvements versus breakthrough, significant improvements.
A. True
B. False
An ANOVA used across many dependent variables could increase the Beta risk.
A. True
B. False
A Non-parametric Test should be used if just one distribution is not Normal out of the two or more gathered.
A. True
B. False
Which Experimental Design typically is most associated with the fewest number of input variables or factors in the design?
A. Response Surface design
B. Full Factorial design
C. Simple Linear Regression
D. Fractional Factorial design
SPC Charts are used extensively in different business and decision-making environments. In this example a vendor is being selected based on speed of delivery. Which of the conclusions would help you pick a vendor for your needs regarding lead-time of delivery from your vendors? (Note: There are 4 correct answers).
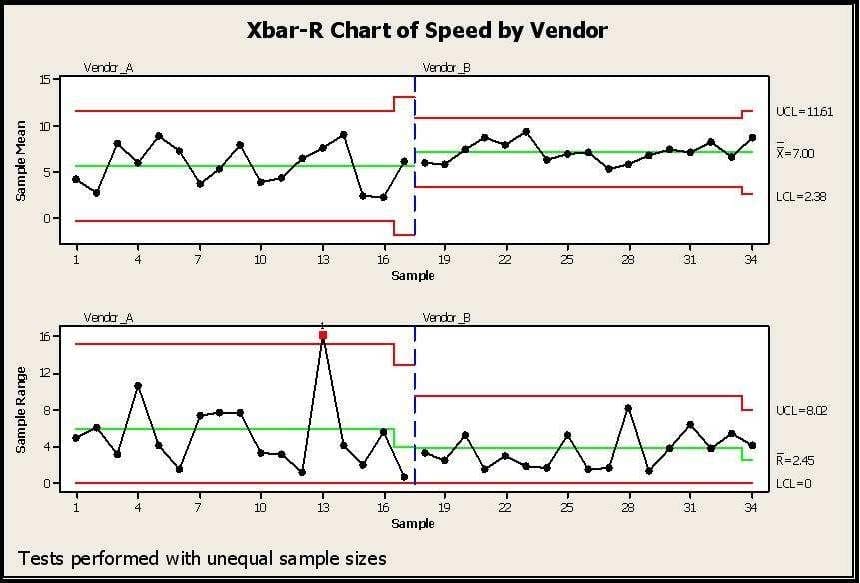
A. Vendor A with a much shorter lead time in delivery
B. Vendor B as it has a better consistency (lower variance) on lead time
C. Vendor B since Vendor A shows a situation out of control as shown in red
D. Vendor B since the Control Limits are much narrower than Vendor A
E. Vendor B has higher lead time, but a process with much narrower Control Limits
Common and Special Cause ______________ are the focus of Statistical Process Control.
A. Prediction
B. Ideation
C. Capability
D. Variation
When we gather information for the Voice of the Business we are primarily interested in information concerning the _____________ of the business.
A. Advertising budget
B. Market share
C. Profitability
D. Ownership
When conducting a Hypothesis Test using Continuous Data the proper sample size is influenced only by the extent to which we need to assess a Difference to be detected but not the inherent variation in the process.
A. True
B. False
Much of the Six Sigma methodology is used to identify and remove causes for _____________ .
A. Process Variation
B. Material Costs
C. Excess Inventory
D. Lost Sales
Why select/choose certbus.com?
Millions of interested professionals can touch the destination of success in exams by certbus.com. products which would be available, affordable, updated and of really best quality to overcome the difficulties of any course outlines. Questions and Answers material is updated in highly outclass manner on regular basis and material is released periodically and is available in testing centers with whom we are maintaining our relationship to get latest material.
![]()
![]()
Copyright © 2004-2025 certbus.com, All Rights Reserved.