C2090-011 Online Practice Questions and Answers
What does the Paste button in this dialog box do?
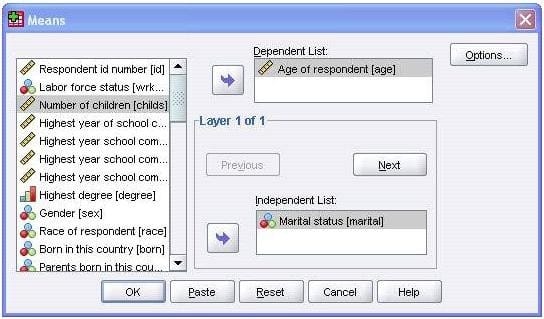
A. Runs a MEANS table.
B. Pastes the MEANS command into a Syntax Editor window.
C. Pastes the MEANS command intothe Viewer window.
D. Runs a MEANS table, opens a new Syntax Editor window, and pastes the MEANS command
Which Pivoting Tray corresponds to the illustrated cross tabulation?
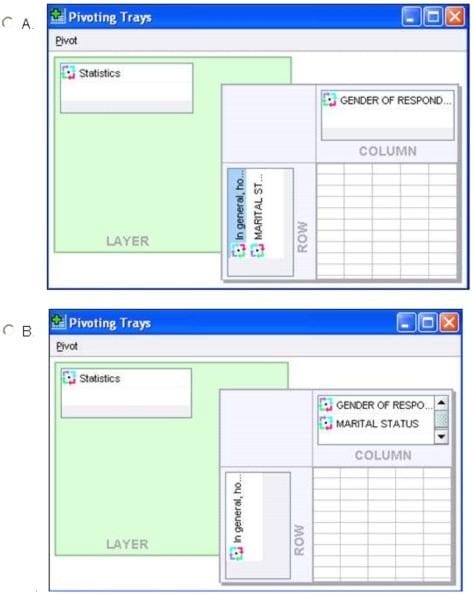
A. Option A
B. Option B
C. Option C
D. Option D
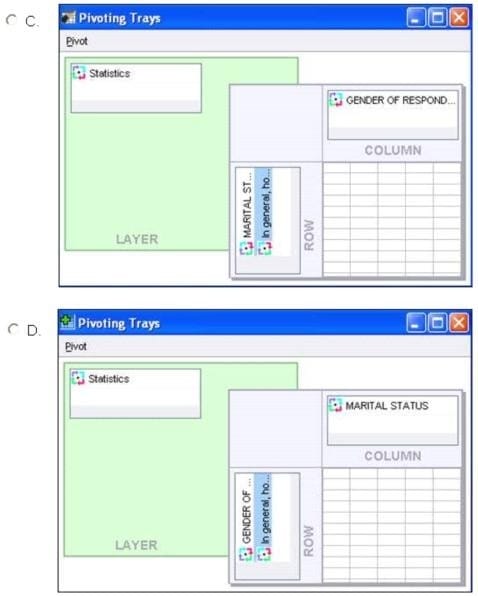
The Compute Variable dialog shown below performs which of the followingoperations? (Choose two.)
A. Sets the value of ParentEduc equal to the value of MAEDUC.
B. Sets the value of ParentEduc equal to the value of MAEDUC if the value of GENDER is
C.
D. Sets the value of ParentEduc equal to the system-missing value if the value of GENDER is blank.
E. Sets the value of ParentEduc equal to the user-missing value if the value of GENDER is blank.
Which operation does this Identify Duplicate Cases dialog not perform?
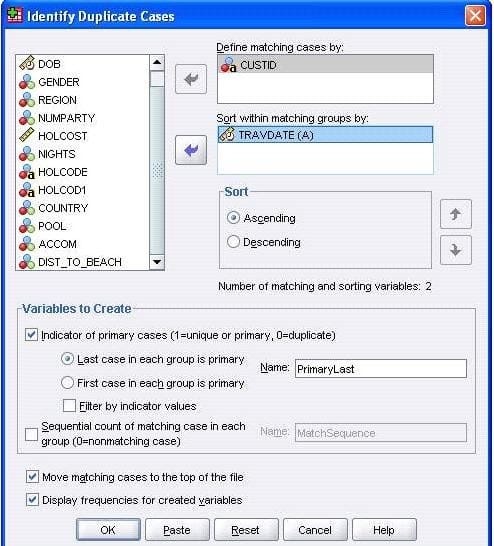
A. Identify duplicate caseswith the same CUSTID number
B. Sort in ascending order duplicate cases within CUSTID by the date of travel (TRAVDATE)
C. Create a new variable PrimaryLast in the dataset
D. Assign the value 1 to PrimaryLast for the duplicate case with the earliest traveldate
The table below shows statistics for two variables. True or false: all people having a valid value for the variable AGE WHEN FIRST MARRIED also have a valid value for the variable AGE OF RESPONDENT.
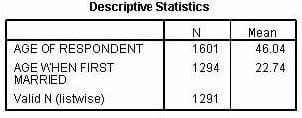
A. True
B. False
What does the Customized Variable View button in the Options dialog allow a user to specify? (Choose three.)
A. The default setting of the Variable View display
B. The attributes that are displayed
C. The size of the Variable View window
D. The display order of the attributes
Consider the table below. Which IBM SPSS Statistics dialog was used to generate it?
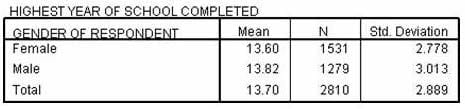
A. The Crosstabs... dialog
B. The Means... dialog
C. The Case Summaries.., dialog
D. The Select Cases... dialog
Which interpretation is correct for this Regression output?
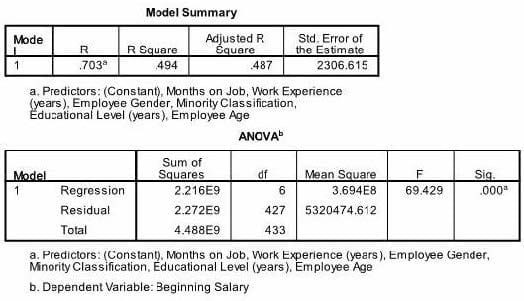
A. We have a non-statisticallysignificant model that accounts for 70% of the variation in the dependent variable.
B. We have a statistically significant model that accounts for 70% of the variation in the dependent variable.
C. We have a non-statistically significant model thataccounts for 49% of the variation in the dependent variable.
D. We have a statistically significant model that accounts for 49% of the variation in the dependent variable.
In order to import data from databasesources such as Access and Oracle into IBM SPSS Statistics, you must first export the data from the database to a tad file and then import this tad file into IBM SPSS Statistics?
A. True
B. False
Using the Compute Variabledialog below, the target variable HighSchool will have the following values. (Choose two.)
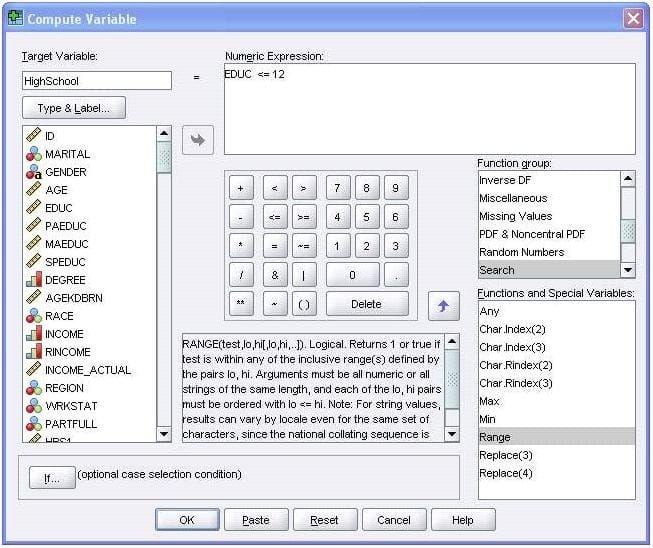
A. Value 1 if EDUC is less than or equal to 12
B. System-missing value if EDUC is greater than 12
C. The same value as EDUC if EDUC is less than or equal to 12
D. Value 0 if EDUC is greater than 12
When you read data stored in an Excel file via File ... Open ... Data, you may need to specify which options? (Choose three.)
A. Read variable names from the first row of data
B. Read aRange of cells
C. Specify the Worksheet to read/import
D. Number of Worksheets to read/import
What type of graph would you use to see the distribution of a scale variable?
A. Barchart
B. Pie chart
C. Histogram
D. Scatter plot
Which interpretation is correct for the IndependentSamples T-Test table shown below?
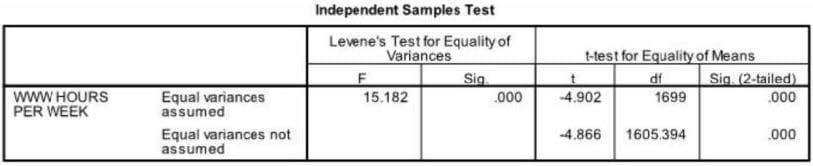
A. We did not meet the assumption of homogeneity of variance; however our two groups differed on the number of WWW HOURS PER WEEK.
B. We did meet the assumption of homogeneity of variance and our two groups differedon the number of WWW HOURS PER WEEK.
C. We did not meet the assumption of homogeneity of variance and our two groups did not differ on the number of WWW HOURS PER WEEK. We did meet the assumption of homogeneity of variance; however our two groups did not differ on the number of WWW HOURS PER WEEK.
The reason you would select the check box next to “indicate case source variable” in the Add Cases dialog box is to:
A. Create a new case in your merged data.
B. Highlight a specific case in one of your variables.
C. Create a variable identifying the case data source.
D. Create a variable identifying the variable data source.
As the sample size increases, the amount of variabilit9 in the distribution of sample means increases.
A. True
B. False
Why select/choose certbus.com?
Millions of interested professionals can touch the destination of success in exams by certbus.com. products which would be available, affordable, updated and of really best quality to overcome the difficulties of any course outlines. Questions and Answers material is updated in highly outclass manner on regular basis and material is released periodically and is available in testing centers with whom we are maintaining our relationship to get latest material.
• 6000+ PDF and VCE exam dumps
• 6000+ Free demo downloads available
• 50+ Preparation Labs
• 20+ Representatives Providing 24/7 Support
![]()
![]()
Copyright © 2004-2024 certbus.com, All Rights Reserved.