CLSSBB Online Practice Questions and Answers
The primary metric for a project is reduced cost for process A .A consequential metric could be:
A. reduced cycle time
B. reduced scrap rate
C. reduced set-up time
D. all the above
E. none of the above
= 0.05 A machine tool vender wants to sell an injection molding machine. The current machine produces 3.2% defectives. A sample of 1100 from the vender 's machine has 2.9% defective. Do these numbers indicate that the proposed machine has a lower rate of defectives?
A. yes
B. no
A stable, normally distributed process with specification 3.50 .03 has = 3.51 and = .016. What percent of the production violates specification?
A. 16.43%
B. 12.62%
C. 18.58%
D. 11.18%
Find the value of (1) in the ANOVA table. Assume:
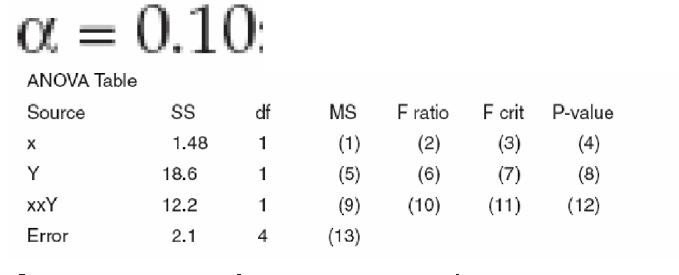
A. 16.4
B. 3.2
C. 18.6
D. 23.2
E. 4.54
F. 12.2
G. 0.525
H. 2.82
I. 1.48
J. 35.4
K. 0.10 L. 0.05 M. 0.01 N. 0.005 O. 0
When Tricia empties a box of capacitors she places it at a designated spot on her work table. Sam notices the empty box and brings a full box of capacitors from the stock room. This is an example of:
A. visual factory
B. kanban
C. poka-yoke
D. standard work
E. set up time reduction (SMED)
If item A is more likely to be detected than item B which will have the highest Occurrence value?
A. item A
B. item B
C. cannot be determined
The primary objective in removal of waste is to improve the Order Production Cycle where the time from _________________ to the time of receipt of payment is compressed.
A. Shift start
B. Product development
C. Receipt of an order
D. New fiscal year
A Factorial Experiment based on a Level 2 Design with 4 factors would require 16 runs to fully assess the interactions.
A. True
B. False
Screening experiments are the proper choice when a Belt is faced with the situation of highly Fractional Factorial Designs.
A. True
B. False
An operator checks that all boxes being packed contain enough products to fill the box. However, each box getting filled has a different number of products in it. This is a Reproducibility problem, not a Repeatability problem.
A. True
B. False
How many experimental runs exist in a Full Factorial and fully randomized design for 4 factors with 2 replicates for the Corner Points and no Center Points? The factors in the experiment are only at 2-levels.
A. 10
B. 32
C. 256
D. 64
Which of the following is NOT an advantage of using a median?
A. Extreme values do not affect the median as strongly as they affect Mean
B. A median can be calculated for qualitative descriptions
C. Median is easy to understand
D. Median can be calculated even for open-ended classes
Which of the following is defined as continuous, incremental improvement?
A. Kanban
B. Kaizen
C. JIT
D. Kaikaku
Which of the following most influences consumer perception of quality?
A. Industry standards
B. Company financial performance
C. Audit results
D. Service and repair policies
Which of the following is a component of a visual factory?
A. Product specifications
B. Zero defect policies
C. Just-in-time policies
D. Equipment service manuals
Why select/choose certbus.com?
Millions of interested professionals can touch the destination of success in exams by certbus.com. products which would be available, affordable, updated and of really best quality to overcome the difficulties of any course outlines. Questions and Answers material is updated in highly outclass manner on regular basis and material is released periodically and is available in testing centers with whom we are maintaining our relationship to get latest material.
![]()
![]()
Copyright © 2004-2025 certbus.com, All Rights Reserved.