A00-240 Online Practice Questions and Answers
Which SAS program will divide the original data set into 60% training and 40% validation data sets, stratified by county?
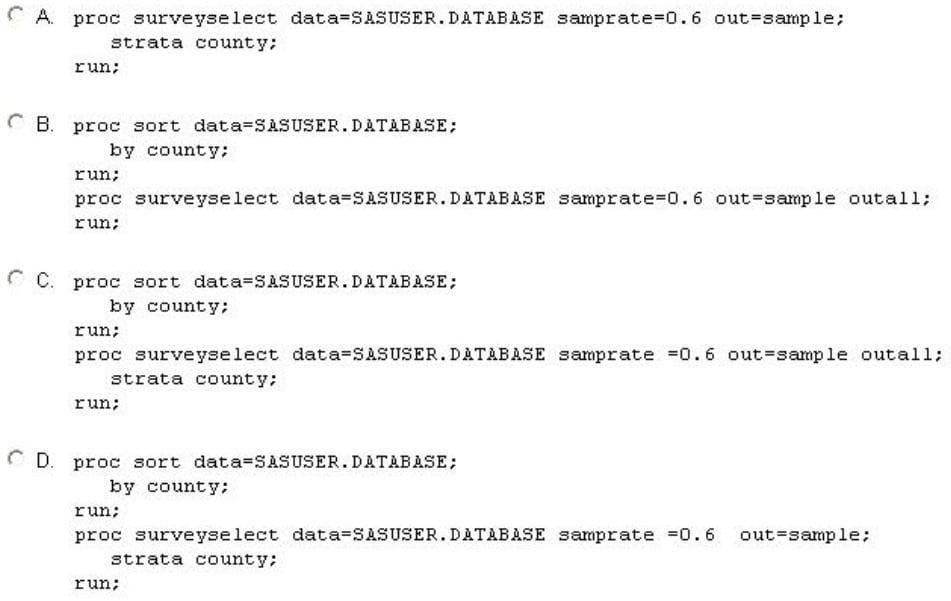
A. Option A
B. Option B
C. Option C
D. Option D
Refer to the lift chart:
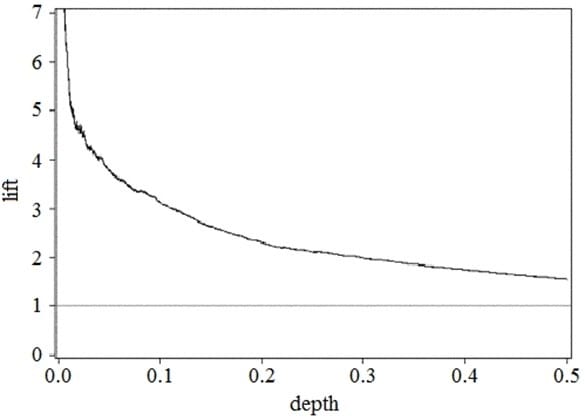
What does the reference line at lift = 1 corresponds to?
A. The predicted lift for the best 50% of validation data cases
B. The predicted lift if the entire population is scored as event cases
C. The predicted lift if none of the population are scored as event cases
D. The predicted lift if 50% of the population are randomly scored as event cases
Suppose training data are oversampled in the event group to make the number of events and non-events roughly equal. A logistic regression is run and the probabilities are output to a data set NEW and given the variable name PE. A decision rule considered is, "Classify data as an event if probability is greater than 0.5." Also the data set NEW contains a variable TG that indicates whether there is an event (1=Event, 0= No event).
The following SAS program was used.

What does this program calculate?
A. Depth
B. Sensitivity
C. Specificity
D. Positive predictive value
Refer to the exhibit: Based upon the comparative ROC plot for two competing models, which is the champion model and why?
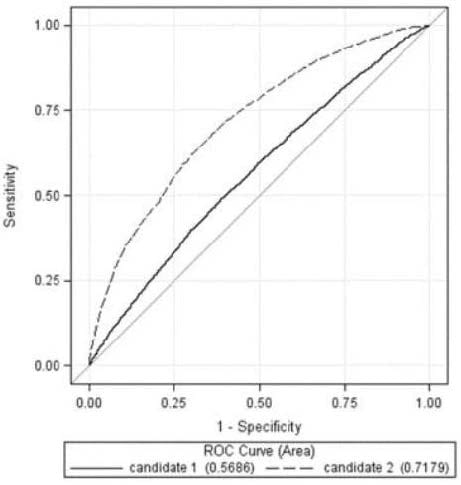
A. Candidate 1, because the area outside the curve is greater
B. Candidate 2, because the area under the curve is greater
C. Candidate 1, because it is closer to the diagonal reference curve
D. Candidate 2, because it shows less over fit than Candidate 1
There are missing values in the input variables for a regression application.
Which SAS procedure provides a viable solution?
A. GLM
B. VARCLUS
C. STDI2E
D. CLUSTER
The standard form of a linear regression model is:
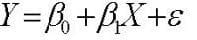
Which statement best summarizes the assumptions placed on the errors?
A. The errors are correlated, normally distributed with constant mean and zero variance.
B. The errors are correlated, normally distributed with zero mean and constant variance.
C. The errors are independent, normally distributed with constant mean and zero variance.
D. The errors are independent, normally distributed with zero mean and constant variance.
Which SAS program will correctly use backward elimination selection criterion within the REG procedure?
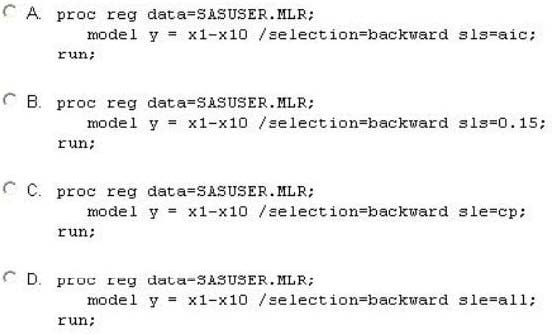
A. Option A
B. Option B
C. Option C
D. Option D
Consider scoring new observations in the SCORE procedure versus the SCORE statement in the LOGISTIC procedure.
Which statement is true?
A. The SCORE statement in the LOGISTIC procedure returns only predicted probabilities, whereas the SCORE procedure returns only predicted logits.
B. The SCORE statement in the LOGISTIC procedure returns only predicted logits, whereas the SCORE procedure returns only predicted probabilities.
C. Unlike the SCORE procedure, the SCORE statement in the LOGISTIC procedure produces both predicted probabilities and predicted logits.
D. The SCORE procedure and the SCORE statement in the LOGISTIC procedure produce the same output.
The following LOGISTIC procedure output analyzes the relationship between a binary response and an ordinal predictor variable, wrist_size Using reference cell coding, the analyst selects Large (L) as the reference level.
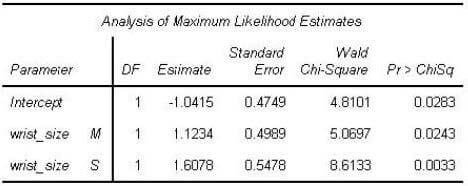
What is the estimated logit for a person with large wrist size?
Click the calculator button to display a calculator if needed.
A. 0.0819
B. 0.5663
C. -3.7727
D. -1.0415
Refer to the exhibit:
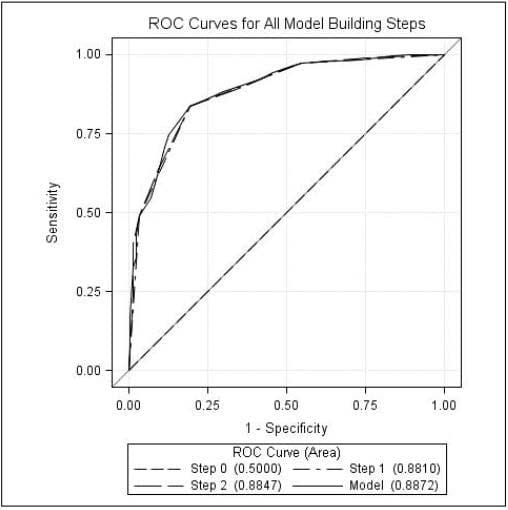
An analyst examined logistic regression models for predicting whether a customer would make a purchase. The ROC curve displayed summarizes the models. Using the selected model and the analyst's decision rule, 25% of the customers who did not make a purchase are incorrectly classified as purchasers.
What can be concluded from the graph?
A. About 25% of the customers who did make a purchase are correctly classified as making a purchase.
B. About 50% of the customers who did make a purchase are correctly classified as making a purchase.
C. About 85% of the customers who did make a purchase are correctly classified as making a purchase.
D. About 95% of the customers who did make a purchase are correctly classified as making a purchase.
A marketing manager attempts to determine those customers most likely to purchase additional products as the result of a nation-wide marketing campaign.
The manager possesses a historical dataset (CAMPAIGN) of a similar campaign from last year.
It has the following characteristics:
1.
Target variable Respond (0, 1)
2.
Continuous predictor Income
3.
Categorical predictor Homeowner(Y, N) Which SAS program performs this analysis?
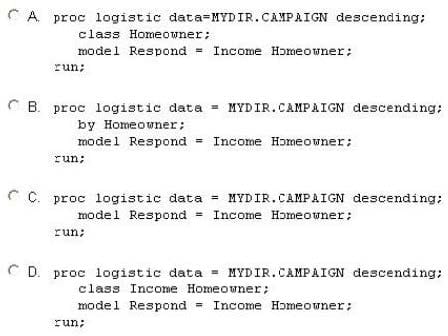
A. Option A
B. Option B
C. Option C
D. Option D
Refer to the exhibit:
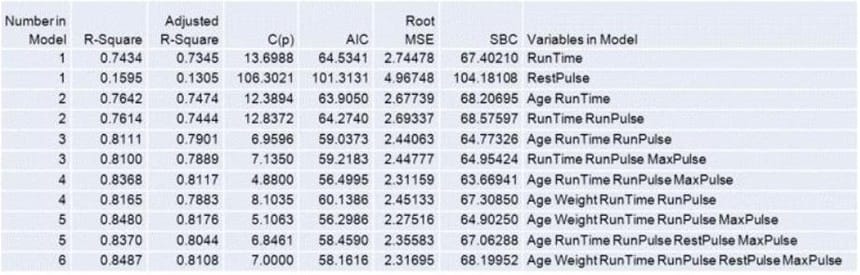
SAS output from the RSQUARE selection method, within the REG procedure, is shown. The top two models in each subset are given. Based on the exhibit, which statement is true?
A. The AIC champion model is more parsimonious than the SBC champion.
B. The SBC champion model is more parsimonious than the AIC champion.
C. The R-Square champion model is the most parsimonious.
D. Adjusted R-Square and R-Square agree on the champion model.
While building a predictive model, median imputations are performed while preparing the training data. How should the imputations be addressed in the validation data?
A. The imputed values are irrelevant to the validation data, and are not used.
B. The imputed values must be applied directly to the validation data without recalculation.
C. The imputed values must be recalculated using the validation data.
D. The imputed values must be recalculated using both the training and the validation data.
What is a benefit to performing data cleansing (imputation, transformations, etc.) on data after partitioning the data for honest assessment as opposed to performing the data cleansing prior to partitioning the data?
A. It makes inference on the model possible.
B. It is computationally easier and requires less time.
C. It omits the training (and test) data sets from the benefits of the cleansing methods.
D. It allows for the determination of the effectiveness of the cleansing method.
An analyst knows that the categorical predictor, zip_code, is an important predictor of a binary target. However, zip_code has too many levels to be a feasible predictor in a model. The analyst uses PROC CLUSTER to implement Greenacre's method to reduce the number of categorical levels.
What is the correct application of Greenacre's method in this situation?
A. Clustering the levels using the target proportion for each zip_code as input.
B. Clustering the levels using the zip_code values as input.
C. Clustering the levels using the number of cases in each zip_code as input.
D. Clustering the levels using dummy coded zip_code levels as inputs.
Why select/choose certbus.com?
Millions of interested professionals can touch the destination of success in exams by certbus.com. products which would be available, affordable, updated and of really best quality to overcome the difficulties of any course outlines. Questions and Answers material is updated in highly outclass manner on regular basis and material is released periodically and is available in testing centers with whom we are maintaining our relationship to get latest material.
![]()
![]()
Copyright © 2004-2025 certbus.com, All Rights Reserved.